Note
Go to the end to download the full example code.
Zig-zag sampling of LORs in a sinogram view
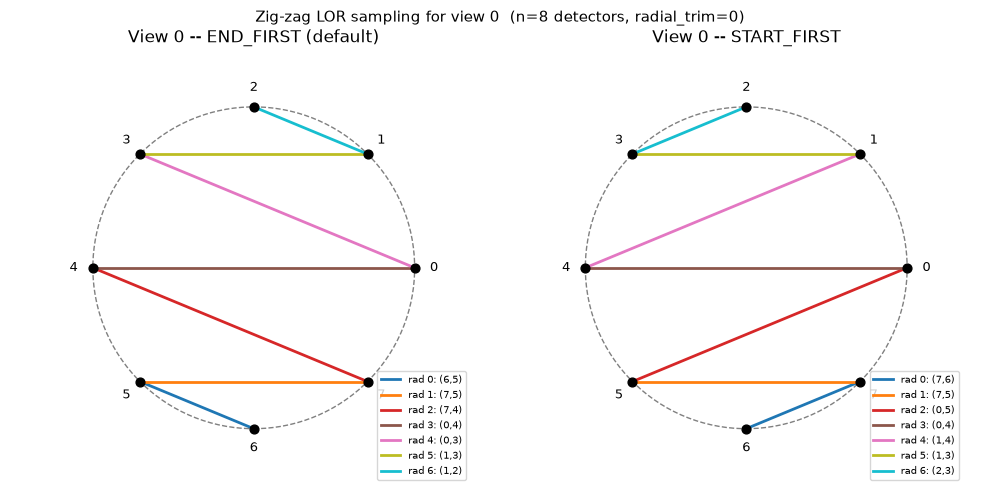
For a given sinogram view, a regular polygon PET scanner connects pairs of in-ring detector endpoints in a zig-zag pattern as the radial bin index moves from the central LOR toward the sinogram edges. Two conventions exist for the ordering of those pairs:
END_FIRST (default): the end detector steps to the next position before the start detector does. Pairs at view 0 (n=8): (0,7), (0,6), (1,6), (1,5), (2,5), (2,4), (3,4), (3,3)
START_FIRST: the start detector steps first. Pairs at view 0 (n=8): (0,7), (1,7), (1,6), (2,6), (2,5), (3,5), (3,4), (4,4)
SinogramZigZagOrder selects the convention via the zig_zag_order
parameter of RegularPolygonPETLORDescriptor.
This example visualises both conventions for a minimal scanner with 1 ring and 8 detector endpoints.
import numpy as np
import matplotlib.pyplot as plt
import parallelproj.pet_scanners
import parallelproj.pet_lors
from parallelproj._examples_utils import suggest_array_backend_and_device

xp, dev = suggest_array_backend_and_device(None, None)
Using array API: array_api_compat.torch, device: cpu
Scanner setup
One ring with 8 detector endpoints, no radial trimming.
n_endpoints = 8
scanner = parallelproj.pet_scanners.RegularPolygonPETScannerGeometry(
    xp,
    dev,
    radius=100.0,
    num_sides=n_endpoints,
    num_lor_endpoints_per_side=1,
    lor_spacing=1.0,
    ring_positions=xp.asarray([0.0], device=dev),
    symmetry_axis=2,
)
Build LOR descriptors for both zig-zag conventions
lor_end_first = parallelproj.pet_lors.RegularPolygonPETLORDescriptor(
    scanner,
    radial_trim=0,
    zig_zag_order=parallelproj.pet_lors.SinogramZigZagOrder.END_FIRST,
)

lor_start_first = parallelproj.pet_lors.RegularPolygonPETLORDescriptor(
    scanner,
    radial_trim=0,
    zig_zag_order=parallelproj.pet_lors.SinogramZigZagOrder.START_FIRST,
)
Print the (start, end) detector index pairs for each view
print("END_FIRST -- (start, end) detector pairs per view:")
for view in range(lor_end_first.num_views):
    s = lor_end_first.start_in_ring_index[view, :].tolist()
    e = lor_end_first.end_in_ring_index[view, :].tolist()
    pairs = list(zip(s, e))
    print(f"  view {view}: {pairs}")

print()
print("START_FIRST -- (start, end) detector pairs per view:")
for view in range(lor_start_first.num_views):
    s = lor_start_first.start_in_ring_index[view, :].tolist()
    e = lor_start_first.end_in_ring_index[view, :].tolist()
    pairs = list(zip(s, e))
    print(f"  view {view}: {pairs}")
END_FIRST -- (start, end) detector pairs per view:
  view 0: [(6, 5), (7, 5), (7, 4), (0, 4), (0, 3), (1, 3), (1, 2)]
  view 1: [(7, 6), (0, 6), (0, 5), (1, 5), (1, 4), (2, 4), (2, 3)]
  view 2: [(0, 7), (1, 7), (1, 6), (2, 6), (2, 5), (3, 5), (3, 4)]
  view 3: [(1, 0), (2, 0), (2, 7), (3, 7), (3, 6), (4, 6), (4, 5)]

START_FIRST -- (start, end) detector pairs per view:
  view 0: [(7, 6), (7, 5), (0, 5), (0, 4), (1, 4), (1, 3), (2, 3)]
  view 1: [(0, 7), (0, 6), (1, 6), (1, 5), (2, 5), (2, 4), (3, 4)]
  view 2: [(1, 0), (1, 7), (2, 7), (2, 6), (3, 6), (3, 5), (4, 5)]
  view 3: [(2, 1), (2, 0), (3, 0), (3, 7), (4, 7), (4, 6), (5, 6)]
Visualisation: all LORs coloured by radial bin for view 0
Detector endpoint positions lie on a circle.
angles = 2 * np.pi * np.arange(n_endpoints) / n_endpoints
xdet = np.cos(angles)
ydet = np.sin(angles)

cmap = plt.colormaps["tab10"].resampled(lor_end_first.num_rad)

fig, axes = plt.subplots(1, 2, figsize=(10, 5))

for ax, lor_desc, title in zip(
    axes,
    [lor_end_first, lor_start_first],
    ["END_FIRST (default)", "START_FIRST"],
):
    # draw detector ring
    circle = plt.Circle((0, 0), 1.0, fill=False, color="gray", lw=1, ls="--")
    ax.add_patch(circle)

    # mark detector endpoints
    ax.scatter(xdet, ydet, color="k", zorder=5, s=40)
    for idx in range(n_endpoints):
        ax.text(
            1.12 * xdet[idx],
            1.12 * ydet[idx],
            str(idx),
            ha="center",
            va="center",
            fontsize=9,
        )

    # draw LORs for view 0, coloured by radial bin
    view = 0
    s_idx = lor_desc.start_in_ring_index[view, :].tolist()
    e_idx = lor_desc.end_in_ring_index[view, :].tolist()
    for rad_bin, (si, ei) in enumerate(zip(s_idx, e_idx)):
        color = cmap(rad_bin)
        ax.plot(
            [xdet[si], xdet[ei]],
            [ydet[si], ydet[ei]],
            color=color,
            lw=2,
            label=f"rad {rad_bin}: ({si},{ei})",
        )

    ax.set_xlim(-1.35, 1.35)
    ax.set_ylim(-1.35, 1.35)
    ax.set_aspect("equal")
    ax.legend(fontsize=7, loc="lower right")
    ax.set_title(f"View 0 -- {title}")
    ax.axis("off")

fig.suptitle(
    f"Zig-zag LOR sampling for view 0  (n={n_endpoints} detectors, radial_trim=0)",
    fontsize=11,
)
fig.tight_layout()
plt.show()
Total running time of the script: (0 minutes 0.280 seconds)